
Staff reports
The number of new COVID-19 cases across the state appears to have dropped, only breaking 1,000 once in the seven-day period ending with Monday, Aug. 17.
And though the past few days have been encouraging – just 451 new cases, 18 in Beaufort County, and an 11.5 positive test rate on Monday – indications are at least some of the decline can be attributed to fewer tests being administered.
Tuesday and Wednesday of last week, there were 928 and 712 news cases reported, respectively. But the positive percentages those days were still high at 20 and 19.6 percent, respectively. Those are close to the positive rates when the state was averaging between 1,500 and 1,800 new cases a day.
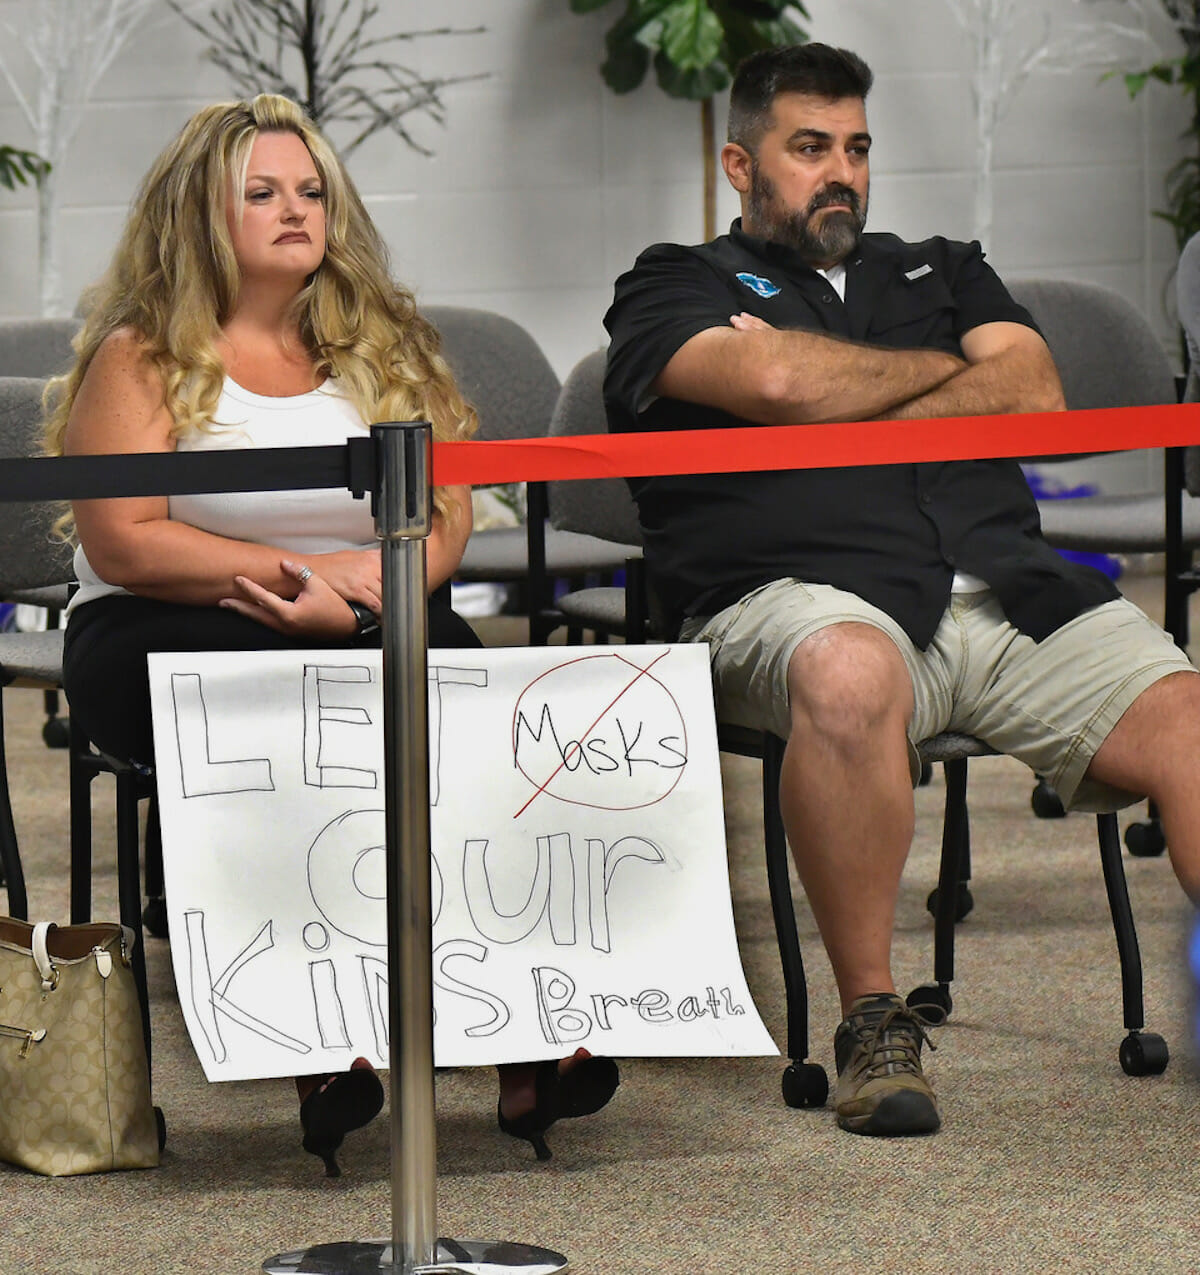
Data says masks are working
The South Carolina Department of Health and Environmental Control (DHEC) released new data last week that indicates local mask ordinances are helping to slow the spread of COVID-19.
“This new data shows us what we already knew, wearing face masks works,” Dr. S.C. State Epidemiologist Linda Bell said in a release. “We’re strongly supportive of these local leaders’ initiatives that are centered on protecting the health and wellbeing of their communities.”
The South Carolina Emergency Management Division has released a regularly updated map showing the counties and municipalities that currently have mask requirements in place, which is available on the home page of scemd.org. SCEMD’s map shows jurisdictions where masks are required by ordinance and where masks have been recommended by proclamation from local elected officials.
Analysis of local mask ordinances show:
As of this week, nearly 40 percent of residents, or approximately 2,000,000 South Carolinians, reside in jurisdictions that have local mask requirements in place.
When comparing the jurisdictions that have mask requirements in place to those that do not, the jurisdictions with mask requirements have shown a 46.3 percent greater decrease in the total number of cases during the four weeks after the requirements were implemented.
“We will be in a much better position in four to six weeks if South Carolinians practice physical distancing and use a mask,” Bell said. “Together, we can completely reverse our fortunes and create safe environments for our business recovery, for our lifestyle recovery, and particularly for our students returning to school in a few short weeks, but we must act more aggressively, and now.”
Data analysis also shows:
Those jurisdictions with mask requirements in place have seen an overall decrease of 15.1 percent of total cases for the four weeks after the requirements were implemented compared to before the requirements were in place. This is an overall decrease of 34.6 cases per 100,000 people from before the mask requirements to after.
During the same time frame, those jurisdictions without mask requirements have experienced an overall increase in total cases of 30.4 percent, as well as an average increase of 24.1 cases per 100,000 people when compared to jurisdictions with a mask requirement in place.
“The residents in jurisdictions that acted first are seeing the benefits earlier,” Bell said. “This shows the sooner prevention measures are adopted, the sooner we all benefit.
On Tuesday, Aug. 11, DHEC unveiled a new online dashboard that provides detailed county-level data that helps provide a localized look at the impacts of the novel coronavirus COVID-19 in South Carolina.
This new dashboard was developed by DHEC’s data analysts, GIS specialists and epidemiologists using information gathered through the agency’s expansive disease surveillance capabilities.
“In what could traditionally take a year or more to develop, our public health and data specialists have built in months an in-depth and interactive online resource for public use that gives a breakdown of demographics, testing, hospitalizations and more for all 46 counties,” DHEC Public Health Director Dr. Joan Duwve, DHEC Public Health Director said in a release. “DHEC has been tracking county-specific data since the first cases of COVID-19 were detected in the state, but the agency’s efforts to consolidate this vast, evolving information into an online resource that will be updated daily is truly amazing, and our state is fortunate to have such an adept team of experts working behind the scenes.”
The dashboard is available by clicking the green “S.C. County-Level COVID-19 Data” button at https://bit.ly/2Q3ZyRN. It will be accessible there for 10 days, after which time it will replace the “Demographics” webpage, as statewide and county-level demographics are both built into this new dashboard. Additional new localized data sets included within it are:
• race, ethnicity, gender and age for cases and deaths in each county
• percent positive for each county
• number of cases per day for each county, dating back to the beginning of March
• number of tests performed for each county (based on an individual’s county of residence)
• number of types of tests (serology or molecular) performed for each county (based on an individual’s county of residence)
• rate of testing per 100,000 residents for each county