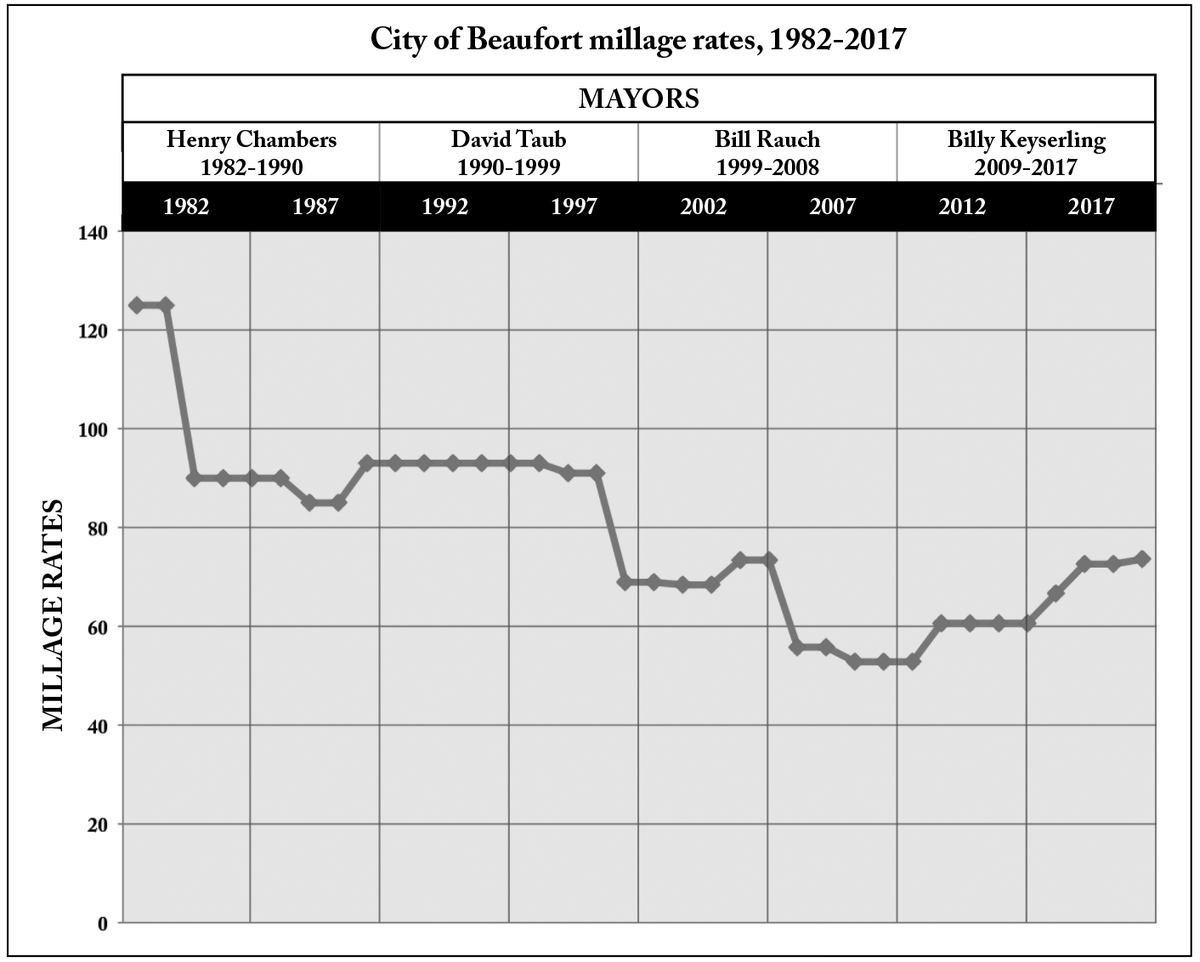
Sources of graph above: Beaufort County CAFRs, and minutes of Beaufort City Council meetings.
By Bill Rauch
In his early runs for mayor, Billy Keyserling – who now calls himself “Mayor Billy” – used to call himself “Billy K” in his campaign literature. In 2004, when he spent lots of his own money and ran hard for mayor, a newspaper story quoted a Mossy Oaks voter as saying, “The ‘K’ stands for the thousand bucks he’ll cost you.”
Now, if we know anything at all, we know that that voter was right on the money.
The election season is upon us again and no one is running against Mayor Billy. Why would they? On June 14, in open session while the council was considering the city’s fiscal year 2017 budget, Keyserling said that he had recently been doing his personal taxes and that in 2015 he spent $50,000 on mayor-related activities … in a year when he wasn’t even running.
But Councilman Michael McFee, who has for the past eight years voted consistently with the mayor, is running. So let’s take a quick look at the city of Beaufort’s spending.
Using information from Beaufort County’s and the city of Beaufort’s websites, I have put together a graph that shows the millage (tax) rates passed by the Beaufort City Council over the past 35 years, which is the entire period for which this information is available on the websites.
At the top of the chart I have listed who was mayor during which period. Mayors lead or at least try to, but they are sometimes outvoted, as I was when I tried to hold the line on taxes when the city was considering its FY 2003 budget. Whether the millage goes up or down is generally considered a key indicator of whether a government is “living within its means.”
There are special exceptions of course, as for example when the voters voted by a 3-to-1 margin to tax themselves to build the municipal complex. Those additional mils (15.62) began appearing on the 2009 tax bills.
Looking at the chart, it’s also important to remember that 1984, 1999 and 2005 were years when a reassessment reduced the city’s millage rate. In 2012, however, following the 2008 crash, property values had crashed too. So, instead of decreasing the millage rate after a reassessment, the city increased its millage rate to collect the same dollars it had collected the previous year. That is justifiable (and legal), although some cities would have under those circumstances cut costs to close the gap.
But there was other spending going on then too, mostly in the name of economic development.
Over several years the city paid over $2 million beginning in 2012 for a Civic Master Plan that has been of negligible benefit. At about the same time the city began paying debt service at 13-plus percent on its $1.85 million Commerce Park that has also been of negligible benefit. The facility must also be advertised and maintained which costs another $100,000 or more each year.
The city also recently entered into a management agreement to pay the city of Charleston $150,000 a year to manage Beaufort’s new digital corridor on Carteret Street. That is on top of the facility’s other costs, including the purchase of the property and the building’s upfit, the details of which have not been made public.
Since 2010 the city’s general fund budget has risen from $13,913,341 to $19,387,961, a nearly $5.5 million dollar increase in just seven years. Taxes have been increased nearly every year during that period, as the graphic illustrates.
But taxes contribute just a part of the city’s revenues. In 2015, for example, the city adopted a tax to help pay for the Boundary Street project in the form of an additional 2-percent franchise fee that appears on city residents’ SCE&G bills. This mechanism is projected to raise $2.8 million by 2022.
SCE&G’s customers already pay the highest per kilowatt hour rate east of the Rocky Mountains, according to the U.S. Energy Information Administration. With the 2 percent added on in the city, the utility’s customers, including businesses, in Beaufort probably now pay more for a kilowatt hour than anybody this side of Alaska. Besides all this, council has also added other new fees.
Critics ask: This is what economic development looks like?
It is always a politically risky proposition when local government wades into areas that are traditionally left to the private sector. Elected officials like it because they can say they are doing something. But for those efforts to continue the voters must be willing to continue to pay for them.


